A single overheated solar cell can drag down an entire string, shave dollars off every kWh you produce, and even invite a fire marshal to your door—yet the damage is invisible to the naked eye. Solar infrared thermography changes that in minutes. Using high-resolution thermal cameras mounted on drones or handheld rigs, inspectors capture temperature maps that pinpoint hidden cracks, failing bypass diodes, loose junction-box lugs, and more—without shutting down your array. If you own, operate, or finance a commercial solar system anywhere in North Carolina, this fast, non-contact scan is the surest way to keep performance, safety, and warranties intact.
In the guide that follows, you’ll learn exactly how infrared thermography works, why North Carolina’s humidity, hurricanes, and temperature swings make it indispensable, and what the inspection looks like from pre-flight planning to the final report. We’ll cover the benefits, cost ranges, provider credentials to demand, common faults revealed, and the maintenance steps that turn colorful thermal images into real dollars saved.
What solar infrared thermography is
Think of infrared thermography as a temperature translator. Every surface above absolute zero emits invisible infrared radiation; a calibrated camera converts that radiation into a color-coded map so you can see where heat is building up inside your photovoltaic system—all without touching a single wire. Because the method is passive and non-destructive, an entire commercial solar layout can be surveyed while the modules stay online and generating revenue. When performed by a qualified technician, a solar infrared thermography inspection in North Carolina delivers lab-grade temperature data in the real-world operating conditions.
Basic principles of infrared imaging
- Location on the spectrum: infrared (IR) lies between visible light (0.4–0.7 µm) and microwaves, spanning roughly 0.7–14 µm. Most PV inspections use the long-wave band (8–14 µm) because it is less affected by atmospheric moisture.
- Emissivity: glass-fronted modules have an emissivity ( ε ) around 0.85. Inspectors enter this value into the camera to avoid under-reporting cell temperatures.
- Resolution vs. accuracy: a 640 × 512 sensor captures four times more pixels than a 320 × 240 unit, making tiny hot spots easier to isolate. Accuracy depends on the Noise-Equivalent Temperature Difference (NETD); professional cameras spec ≤ 0.05 °C so a 2 °C hotspot doesn’t get lost in noise.
- Governing physics: radiant power follows the Stefan–Boltzmann equation
Q = εσT^4, meaning a small rise in cell temperature can signal a large increase in resistive losses.
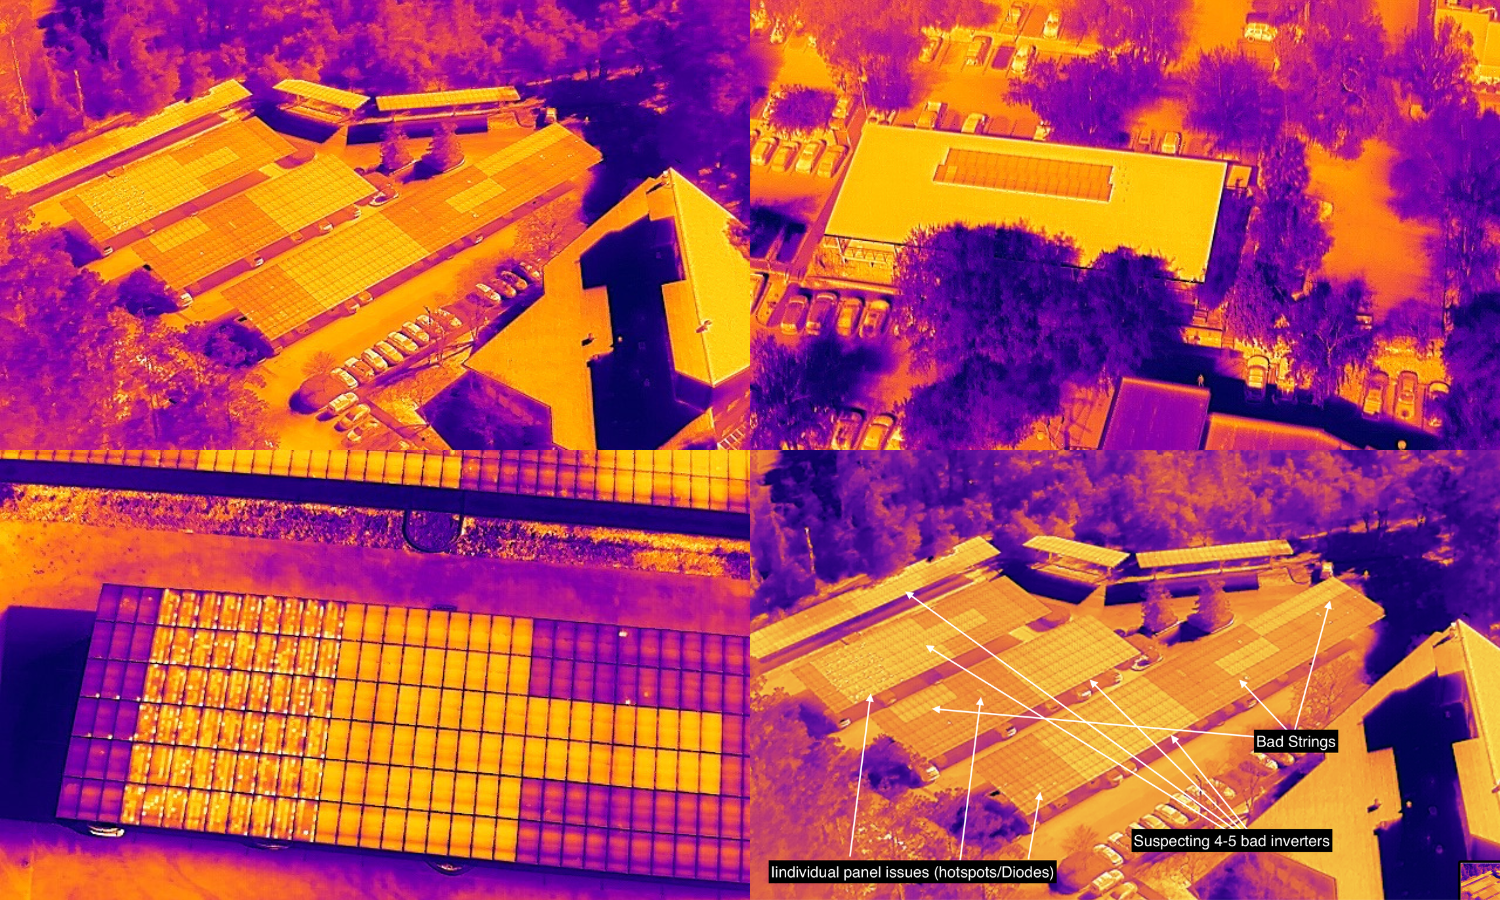
How heat signatures reveal PV system issues
Electrical and mechanical faults convert current into unwanted heat. Common thermal patterns include:
- Hot-spot triangle on one or two cells—often a cracked wafer or bad solder ribbon.
- Uniformly hot half-module—telltale of a shorted bypass diode.
- Zebra-stripe strings—indicates series mismatch or reverse bias after partial shading.
Because temperature deltas can be captured to ±2 °C, inspectors can grade severity: ΔT < 10 °C is “monitor,” 10–20 °C is “repair soon,” > 20 °C is “shutdown risk.”
Equipment and platforms used
- Handheld radiometric cameras: ideal for spot checks on a residential roof or troubleshooting a single inverter string.
- Pole or mast systems: extend reach over ground mounts without drone permits.
- Drone-mounted payloads: game-changer for commercial rooftops and utility sites; autonomous flight plans cover up to 60 MW per day.
- Typical specs: 640 × 512 resolution, 13 mm lens, ≤ 0.05 °C NETD, GPS-tagged radiometric files.
- Advantages in North Carolina: skip steep pitched roofs, minimize downtime after a thunderstorm, and obtain data during the long summer dusk when irradiance is steady.
Modern software stitches thousands of images into a georeferenced orthomosaic, overlaying temperature, RGB imagery, and string layout so maintenance crews can locate faults with a single tap on a tablet. The result is actionable intelligence—no guesswork, no unnecessary panel pulls, just targeted repairs that keep your array cool and your kilowatt-hours flowing.
Why North Carolina solar owners need infrared inspections
From the Outer Banks to the Blue Ridge, North Carolina throws every type of weather at a solar array: sticky summer humidity, afternoon thunderstorms that pop up out of nowhere, cold Appalachian mornings, and the occasional brush with a tropical storm. Each of these conditions accelerates wear in ways that are invisible to the eye but crystal-clear in a thermal scan. A regular solar infrared thermography inspection in North Carolina isn’t a luxury add-on—it’s the only practical way to see how fast the climate is aging your investment and to intervene before energy and warranty dollars slip away.
Climate-driven stress on PV modules
Rapid temperature swings expand and contract cell solder joints thousands of times a year. That cycling breeds micro-cracks that eventually become hot spots. Coastal and Piedmont humidity pushes moisture through backsheet pinholes, corroding busbars and bypass diodes. Add salt fog at the shore and ash pollen in the Sandhills, and you have a perfect storm of conductive grime that raises series resistance and module temperature. Infrared cameras capture these thermal anomalies long before they trip an inverter fault code.
Common defects found in NC solar arrays
- PID (Potential Induced Degradation) clusters on humid, ungrounded systems—recognized by a cool perimeter and a white-hot center in the thermal view.
- Backsheet delamination on high-UV, high-altitude arrays west of Asheville, creating patchy heat islands.
- Junction-box scorch marks after lightning-rich summer storms—presenting as circular heat blooms 15–20 °C above ambient.
- Cable hot spots where squirrels and copper-seeking rodents have gnawed through insulation.
Each defect costs production: a single PID-stricken string can drag down output 20 %, while a failed diode can halve a module’s yield.
Regulatory & utility considerations
Duke Energy’s interconnection agreement requires “ongoing maintenance to prevent safety and reliability hazards,” language insurers interpret as yearly thermal documentation for systems over 20 kW. The 2023 National Electrical Code, adopted statewide, references IR imaging as an accepted commissioning test for large PV installations (Article 706.7). Many commercial lenders now place similar clauses in solar finance contracts, withholding a portion of funding until a radiometric report is filed. Failing to schedule an annual inspection can therefore jeopardize not just energy yield but also insurance coverage and loan compliance—an expensive oversight easily avoided with a scheduled thermography survey.
Key benefits of regular thermographic surveys
A routine survey spots fledgling problems early, documents evidence that keeps manufacturers and insurers honest, and squeezes every last kilowatt-hour out of your investment. Below are the three payoffs North Carolina owners tell us matter most.
Early fault detection & reduced downtime
High-resolution imagery exposes cell-level heat anomalies long before string monitoring or inverter alarms light up.
- One hot spot can slash the affected module’s output by up to 50 %.
- Left unchecked, that defect raises the temperature of neighboring cells, widening the damage zone and risking thermal runaway.
Warranty protection and insurance claims
Module makers like REC, QCELLS, and Canadian Solar increasingly require radiometric imagery to validate factory defects. A time-stamped IR report proves the issue is intrinsic—not storm related or installation error—streamlining RMA approvals. Insurers apply the same logic after hurricanes or hail. Showing “before” and “after” thermal maps:
- Confirms the date of damage
- Speeds claim payout
- Reduces disputes over partial-string degradation versus acute impact
Maximizing energy yield and ROI
The table below uses the North Carolina average retail rate of $0.13 / kWh and assumes a 100 kW system producing 140,000 kWh per year.
| Fault type | Typical production loss | Annual kWh lost | Annual $ lost |
|---|---|---|---|
| Single hot spot | 5 % | 7,000 | $910 |
| Failed bypass diode | 10 % | 14,000 | $1820 |
| PID-affected string | 20 % | 28,000 | $3640 |
| Full inverter down | 50% | 70,000 | $9100 |
- Even minor module-level issues quickly become four-figure annual losses at 100 kW.
- PID or diode failures left unresolved can erase $3–4k per year, compounding over system life.
- At commercial scale, fault detection and remediation pay for themselves very quickly.
Multiply those savings across a 25-year lifespan, and regular solar infrared thermography inspections in North Carolina emerge as one of the highest-ROI maintenance moves you can make.
The Solar infrared inspection process step by step
Booking a solar infrared thermography inspection in North Carolina is simpler than many owners expect. Understanding the cadence helps you plan outages (usually none), allocate staff, and set realistic expectations for deliverables and cost.
Pre-survey preparation and safety planning
Every successful scan starts at a desk, not on a roof. The provider gathers system data—array size, string map, inverter firmware, module make and model, and any prior alarms from your monitoring portal. Weather is checked for the required irradiance window (≥ 600 W/m² with stable sky conditions). A site-specific safety plan is drafted that covers:
- Lock-out/tag-out of combiner boxes if physical access is needed
- OSHA fall-protection anchors for pitched or multi-story roofs
- Arc-flash boundaries and PPE for ground crew
- FAA Part 107 airspace clearance for drone flights within controlled zones like CLT or RDU
On-site data capture
With prep complete, the crew moves to image acquisition. Ground inspectors carry radiometric cameras fitted with 24 mm lenses for close-up work along walkways. Drone pilots load an autonomous flight plan with 70 % lateral/30 % longitudinal overlap to ensure no cell is missed. A 500 kW commercial roof typically produces 2,000–3,000 radiometric images in under two hours, all while the array keeps exporting power.
Post-processing, analysis, and reporting
Back at the office, software such as FLIR Thermal Studio or Raptor Maps auto-stitches images into a georeferenced orthomosaic. An analyst reviews every anomaly, assigning severity grades based on ΔT thresholds (<10 °C monitor, 10–20 °C repair, >20 °C urgent). The final PDF bundle contains:
- Annotated IR and RGB images with GPS tags
- Fault table listing string, module ID, and recommended action
- Portfolio-level loss estimate in kWh and dollars
- Raw radiometric files for warranty or insurance submission
Typical timeframe and cost ranges in North Carolina
Turnaround for most projects is fast:
| System size | On-site time | Report delivery | Typical cost* |
|---|---|---|---|
| 5–15 kW home | 1–2 hrs | 24 hrs | $250–$450 |
| 100–500 kW commercial | 4–8 hrs | 2–3 days | $0.08–$0.15 per W |
| >1 MW + | 1–2 days | 3–5 days | To be determined |
*Prices reflect 2026 averages and include travel within the state. Mobilization surcharges may apply for mountain or barrier-island sites, but many providers waive them when the scan is bundled with annual O&M. By knowing the steps and numbers up front, you can slot a solar infrared thermography inspection into your maintenance calendar with zero guesswork.
Choosing a qualified thermography provider in North Carolina
A high-resolution camera means nothing if the operator doesn’t know how to use it or can’t translate the data into actionable fixes. With dozens of contractors advertising “thermal scans” online, picking the wrong outfit can leave you with pretty pictures and no path forward. Use the checklist below to separate true solar specialists from generalists and make sure your next solar infrared thermography inspection in North Carolina delivers a return, not a headache.
Required Certifications and Technical Credentials
North Carolina has no single license for PV thermography, so third-party credentials do the talking. Prioritize firms that can show:
- Level II or Level III infrared thermography certification (e.g., Infraspection or ITC)
- NABCEP PV Commissioning & Maintenance Specialist or PV Installation Professional—proof they understand the electrical side, not just the imaging
- FAA Part 107 Remote Pilot for any drone work; hefty fines await unlicensed flights
- OSHA 30 or state-approved fall-protection training for rooftop arrays
Ask to see the actual certificates—professional providers are proud to share them.
Warning signs and red flags
- No sample reports with GPS-tagged anomalies
- Quoting flat fees without discussing site size, roof pitch, or airspace restrictions
- Using non-radiometric cameras (look for NETD ≤ 0.05 °C in the specs)
- Pushing costly add-ons—like full IV-curve tracing—before you’ve even seen the thermal results
If any of these pop up, keep shopping.
DIY vs. professional thermal inspections
Thermal cameras have never been cheaper—scroll Amazon and you’ll find plug-in phone sensors for under $300. Tempting? Absolutely. But before you head to the roof with a new gadget, weigh what you gain against what you risk. A do-it-yourself pass can spot glaring defects, yet it rarely satisfies warranty, safety, or utility requirements. Here’s how the two approaches stack up.
Handheld cameras: capabilities and limitations
Entry-level units (160 × 120 px, ±2 °C accuracy) reveal large hot patches and obvious bypass-diode failures. They’re fine for a quick look at a 10-panel string after a hailstorm. What they miss:
- Sub-cell cracks with ΔT < 5 °C
- PID gradients that only appear at full irradiance
- GPS tagging and radiometric data required for manufacturer claims
In short, they show “something’s warm” but not “what, why, and how urgent.”
Safety risks on rooftops and ground-mounts
Rushing to grab a few snapshots can expose you to:
- 1000 V DC arcs when opening combiners without PPE
- Slippery pollen-coated shingles common in North Carolina’s spring
- FAA fines
- Surprise encounters with wasp nests or copperhead snakes around ground racks
A professional crew arrives with fall-protection gear, lock-out/tag-out procedures, and Part 107 licensing.
When a professional is absolutely necessary
Skip the DIY route if:
- You plan to file a warranty or insurance claim—manufacturers demand radiometric files.
- The system exceeds 50 kW; string-level losses hide in the noise of low-res cameras.
- The array is financed—lenders often require third-party annual IR reports.
In those cases, a certified thermographer delivers defensible data, actionable repair lists, and peace of mind that a $300 gadget simply can’t match.
Maintenance actions after an infrared survey
In addition to $10,000+ cameras, maintenance teams have their hands on specialized thermal image processing software allowing them to modify wavelength and contrast, as each pixel of a radiometric thermal image has a temperature value attached to it. Color-coded images are only the first half of the job; the payoff comes when the maintenance team turns those pixels into lower resistance, cooler cells, and higher kWh. Because most anomalies fall into three buckets—dirt, damaged conductors, or data blind spots—the remediation plan usually follows a predictable sequence. Below are the best-practice steps North Carolina owners take once the thermography report hits their inbox.
Electrical repairs and re-commissioning
Thermal signatures above 15 °C demand hands-on electrical work.
- De-energize the affected string and perform visual inspection.
- Re-torque junction-box lugs to manufacturer spec (often 35 in-lb).
- Replace cracked modules, scorched connectors, or failed bypass diodes on a one-for-one basis—mixing wattages voids many warranties.
- Finish with insulation-resistance and IV-curve tests to confirm the repair eliminated the hot spot.
Monitoring upgrades and continuous improvement
Once the obvious flaws are fixed, close the feedback loop.
- Add string-level monitoring or module-level power electronics (MLPE) where repeated imbalances appear.
- Configure inverter alerts to flag temperature-correlated voltage drops, reducing reliance on periodic scans alone.
- Schedule a follow-up infrared survey 30–45 days after major repairs to verify results and update your baseline imagery.
A disciplined maintenance cycle—clean, repair, validate—turns a one-off thermography report into year-over-year performance gains.
Keeping your North Carolina solar array at peak health
A cool-running PV system is a profitable, worry-free PV system. Regular infrared thermography catches hidden heat before it snowballs into lost kWh, failed warranty claims, or—worst case—fire risk. Pair the yearly scan with a spring pollen wash, mid-season torque check, and winter visual walk-through, and you’ve built a maintenance loop that:
- Preserves safety for crews and first responders
- Keeps production on the high side of projections
- Protects every warranty and insurance policy tied to the array
Most home and commercial owners fold the inspection into their annual budget; utility managers write it into O&M contracts. Either way, the math is the same: one afternoon of imaging costs less than one overheated module.
Ready to lock in those savings? Reach out to the solar family at PPM Solar for a no-obligation thermography quote and start the next season cool and confident.